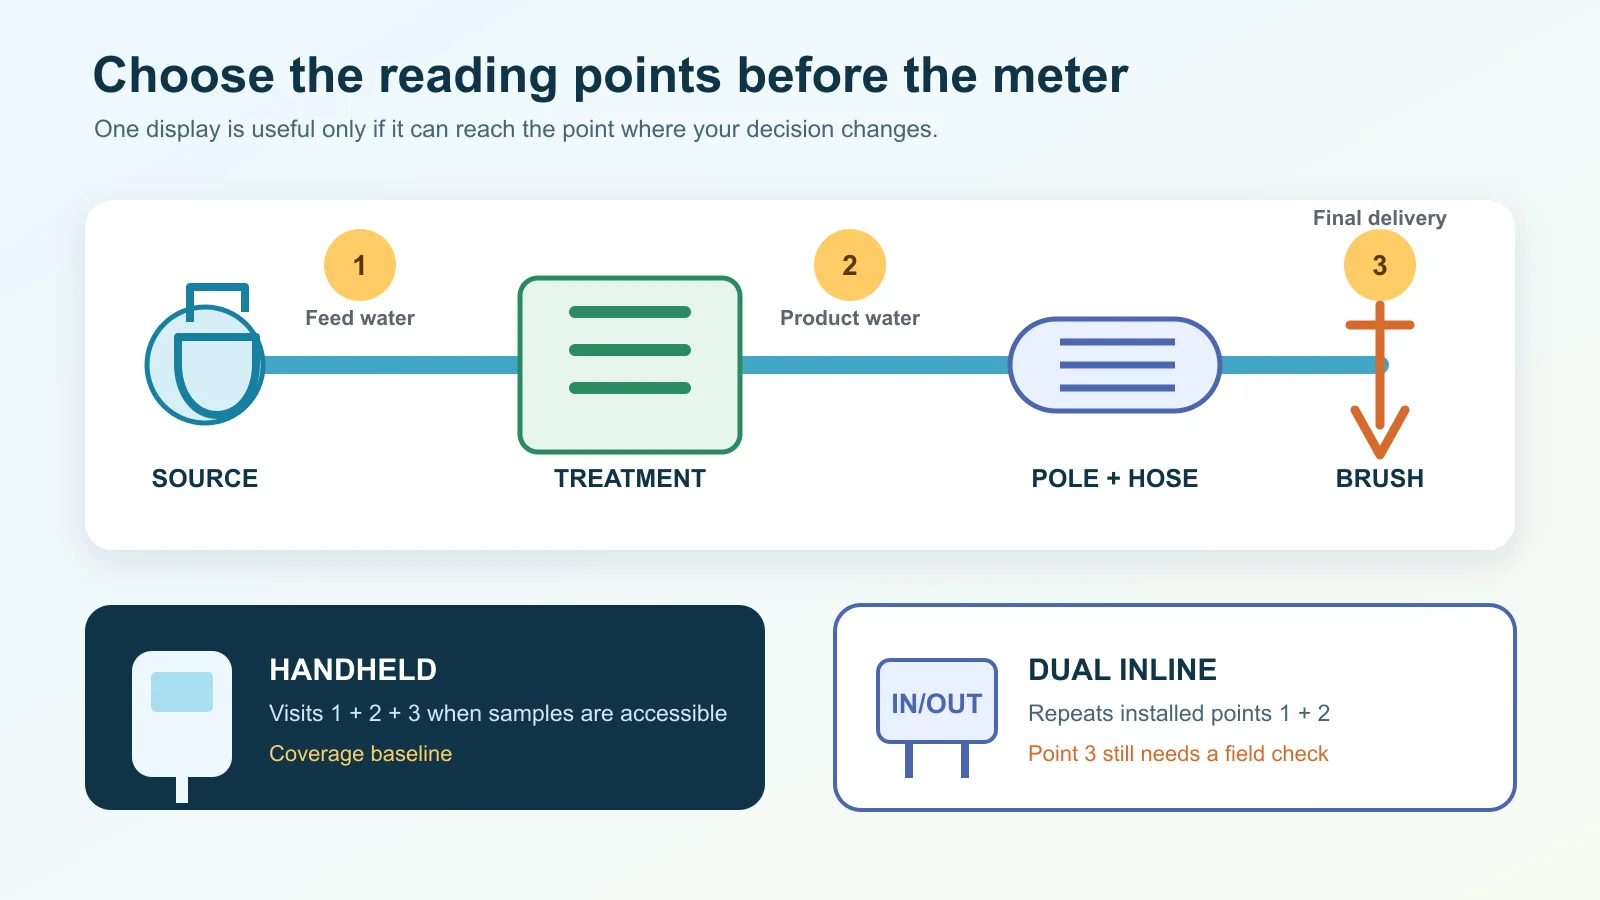
Before comparing TDS meters, draw the water path from the tap to the brush. Mark every place where a reading would change a decision. A high maximum range cannot compensate for a meter that never sees the water you need to diagnose.
For most pure-water window-cleaning systems, the useful map has three points: feed water before treatment, product water after treatment, and final delivery after the hose or at the brush. A handheld meter can visit accessible samples at all three positions. A dual inline monitor makes repeated readings easier at two installed positions, but it does not become a brush-end test simply because both numbers appear on one display.
That makes a handheld meter the coverage baseline and an inline monitor an optional repetition layer. Buy the inline unit first only when its exact probe positions and fittings match the rig and another method still covers the final delivery point.
This page does not choose the filtration train. Start with the water-fed pole system guide if source water, treatment stages, flow and pole demand are still unsettled. Once that path is fixed, the meter has a specific job instead of a generic feature list.
Mark three places where the number can change
A TDS meter does not directly weigh every dissolved substance. It measures electrical conductivity and converts that signal to an estimated total-dissolved-solids value. HM Digital explains this conversion in its COM-100 manual. That is why the meter model and conversion scale belong beside the number: two displays can use different factors even when the water sample is the same.
Give each measurement point one decision. Do not collect a number merely because a display is available.
| Point | Question it answers | Minimum access | Meter coverage | Keep with the reading |
|---|---|---|---|---|
| 1. Feed water | What water is entering this job’s treatment path? | A clean sample before treatment | Handheld sample, or an inline feed probe | Source location and whether the system was bypassed or running |
| 2. Product water | What leaves the treatment stage at this moment? | A sample port or an exact installed output probe | Handheld sample, or an inline product probe | Treatment stage, flush state and meter scale |
| 3. Final delivery | Did the water path after treatment change the delivered reading? | Water collected after the working hose or at the brush | A handheld sample unless a documented probe exists at that exact point | Hose/pole path and time since the system began flowing |
The three readings do not need three instruments. They need three reachable samples. J.Racenstein’s current window-cleaning TDS guide likewise distinguishes source, treatment output and brush-end checks. Its operating thresholds are merchant guidance, not a universal rule used here; the durable part is the separation of locations.
A handheld meter is the coverage baseline
A portable meter earns its place by moving between samples. On a small DI setup, one handheld can check the source before treatment, collect product water after the vessel and then sample water at final delivery. It is slower than glancing at an installed display, but it closes the widest diagnostic area with one instrument.
The current HM Digital TDS-3 page lists a 0–9990 ppm range, 1 ppm resolution from 0 to 999 ppm, 10 ppm resolution above that band and ±2% accuracy from 0 to 5000 ppm. It uses an average 0.5 NaCl conversion factor, has automatic temperature compensation within its declared range, and is factory calibrated with a 342 ppm NaCl solution with manual recalibration. Those facts describe one exact model; they do not prove that every inexpensive pen sold as a TDS meter shares them.
The TDS-3 page does not claim a waterproof housing. A carrying case and a meter used around water are not an ingress rating. If a wet field environment makes housing a purchase requirement, keep that box open instead of inferring it from the product category.
A higher-spec handheld can close different fields. HM Digital’s current COM-100 page lists 0.1 ppm resolution below 100 ppm, selectable KCl, 442 and NaCl conversions, digital calibration, a replaceable probe and IP-67 waterproof housing. Those are real differences, but they matter only when your log, calibration practice or field environment uses them. They are not evidence that the model cleans glass better.
An inline display buys repetition, not reach
An inline monitor makes sense when the same two positions need to be checked repeatedly and stopping to collect both samples is the friction you are solving. The current HM Digital DM-1 page defines that job precisely: one probe reads feed water and the other reads product water.
The DM-1 ships with two 1/4-inch T fittings and identifies 3/8-inch or 1/2-inch alternatives. Its current page lists a 0–9000 ppm range, ±2% accuracy, an average 0.5 NaCl conversion factor, factory calibration with 342 ppm NaCl solution and analog calibration. It also lists 1 ppm resolution from 100 to 999 ppm and 10 ppm from 1000 to 5000 ppm.
Do not fill the gaps in that specification. The captured product page does not state the resolution from 0 to 99 ppm, an ingress-protection rating or automatic temperature compensation. The current HM Digital catalog may carry adjacent family information, but an order decision for the exact DM-1 should keep the product-page fields distinct until its current manual or manufacturer closes them.
The fitting is a hard gate, not an accessory footnote. “Available in 1/4 inch” does not prove a match to the tubing, probe orientation or sample position already on the cart. Freeze the exact meter variant and fitting size in the order record.
Most importantly, two installed probes still cover only two installed points. If both sit around the treatment system, a field sample remains the honest way to check final delivery. That can mean keeping the original handheld even after adding the inline display.
Low-end readings expose the real specification differences
Maximum range is easy to compare and rarely the whole purchase. Around a filtration system, the useful distinctions often appear at the low end: the displayed increment, the scale behind the displayed number, and the method available to verify calibration.
| Exact model | Form and declared coverage | Low-end display | Scale and calibration | Field still open |
|---|---|---|---|---|
| HM Digital TDS-3 | Handheld; operator selects the sample | 1 ppm from 0–999 ppm | Average 0.5 NaCl; factory 342 ppm NaCl; manual adjustment | No waterproof rating on the current product page |
| HM Digital DM-1 | Dual inline; feed and product probes | Current page starts its stated 1 ppm band at 100 ppm | Average 0.5 NaCl; factory 342 ppm NaCl; analog calibration | 0–99 resolution, ATC and housing rating on the captured page |
| HM Digital COM-100 | Handheld; operator selects the sample | 0.1 ppm from 0–99 ppm | Selectable KCl, 442 or NaCl; digital calibration | Whether the added modes and serviceable probe justify the cost for this route |
Resolution and accuracy answer different questions. A display that moves in 0.1 ppm increments is not automatically accurate to 0.1 ppm; the COM-100 still publishes ±2% accuracy. Likewise, a ±2% accuracy statement does not tell you the smallest step the display will show. Keep both fields.
The conversion scale matters whenever readings are compared over time or between meters. If a selectable meter changes from its 0.5 scale to another factor, record the change rather than treating the next number as a direct continuation of the old series.
Build a log that another reading can actually join
A single TDS number has little diagnostic value without its place and instrument. Use one line for every observation:
- Measurement point: feed, named treatment output or final delivery.
- Exact meter and mode: model plus ppm/EC mode and conversion scale where selectable.
- Reading and unit: preserve what the display actually reported.
- System state: note whether treatment was running, flushing or recently started.
- Water path: identify the vessel, membrane stage, hose or brush represented by the sample.
- Date and time: enough to join the reading to filter, resin or configuration changes.
Measurement technique belongs to the exact manual. The COM-100 manual, for example, instructs the user to select the intended mode, dip the meter into the sample, remove trapped air and wait for the reading to stabilize. It also requires the calibration solution to match the selected mode and calls for a fresh certified solution when calibration is checked. Do not turn those instructions into a universal procedure for a different meter.
Once feed TDS is measured and logged, it can be used as an input to the site’s DI or RO/DI system selector. That tool estimates a planning path from source TDS and workload; it does not validate the meter or replace the product-water reading.
Close the cart with a point-by-point record
Write the order decision on the same sheet as the measurement map. Use one row for the handheld and one for any installed monitor. Each row should name the exact model, every point it covers, low-end resolution, accuracy scope, conversion scale, calibration method, housing claim and—when inline—the fitting and probe positions.
Four results are honest:
- One handheld covers the required points: all samples are accessible and repeated fixed monitoring is not worth a second device.
- Add a dual inline monitor: exact feed and product probe positions, fittings and specifications are closed, and repeated installed readings solve a real operating task.
- Add or keep a field meter: fixed monitoring is useful, but final delivery still needs a movable sample.
- Hold the exact model: the cart lacks a current scale, low-end resolution, calibration path, housing requirement or fitting match.
Do not let a resin estimate set the meter choice backward. The DI tank resin-life guide uses measured inputs to plan service intervals, while actual product-water observations remain the operating evidence. The measurement points and exact instrument record come first; the system and resin decisions can then use numbers that are traceable.